IES reports are one illustration that depicts how you can distribute the lighting procedure of the lamp evenly in a particular room. However, this data is much more efficient for the manufacturers to convey realistic and rational aspects of light used in the room.
However, the artists use the data involved in the IES report to put the junctures of the images and the refractivity in a more rational way. However, it’s difficult to gather the correct information from the file with the help of the trial and error method.
How Do I Open An IES Report On My Computer?
You are trying to figure out why you can’t open any of the IES reports on your computer. Well, this all is happening because you are not using the correct application to open it. Despite having Microsoft Word, it’s impossible to open this file as these reports don’t support the IES reports. If one can open such reports in Word, there is a high chance of disruptive formatting of the entire information.
That’s why it’s important to install either Microsoft Notepad or Microsoft Wordpad. However, excluding these applications, several applications are also there with which one can open these reports.
If you have both Microsoft Notepad and Microsoft Wordpad, how can you choose your preferred application to open the IES report? At first, you need to left-click the file and select the option open with. After selecting this option, you will get both options. However, you can proceed to the opening procedure by selecting your preferred application.
Understanding The Basics Of Light Distribution
It’s imperative to introduce the lux information to the software for any stimulation by the designers. Concerning this, you should make the required adjustment to avoid any problems in the project. However, the effect of stimulation lessens the cost, heightens efficiency, and so on.
Nonetheless, the light distribution section is operated by the lux information, which in other terms, is called the luminous intensity distribution curve. Along With The characteristics of the light source, it also enlightens the features which specify the distribution of light concerning directions of space. To be very specific, it identifies the spatial distribution of the glare.
How To Get The Light Distribution Data?
Goniophotometers are instruments with which one can measure the distribution of light data by their sources. During performing any test with this instrument, the goniophotometer remains static and doesn’t change its position.
But the luminaire revolves around the vertical axis (γ axis) and the horizontal axis (C plane axis). However, the crucial reason for this kind of rotation is to figure out the intensity of the light distributed in space.
Usually, there are two main representation methods: polar and rectangular. After looking into the ability of the lamps as well as their rotating angle, you can differentiate it into three distinct photometric test methods viz, Type A, B, C.
For signal or car lights, the method which is generally used is the Type A test method. However, Type B and Type C test methods are used for floodlights and indoor lamps.
Decoding IES Report
Decoding the IES report is not everyone’s cup of tea. To figure out what the report is starting, you need to have a high level of technical knowledge.
However, the different parts of an IES report are mentioned below to make the entire procedure easy.
What Does An IES Report Look Like?
Part 1: Product Information
According to IESNA: LM-63-2002, the goniophotometer test methods are tested according to an update made in 2002. However, you should test the equipment models with Keyword 1~ n lists with the help of a goniophotometer.
When the equipment is tested, several other pieces of information, like the Type and model of the lamp, along with its voltage and current capacity, can be identified.
Part 2: Test Information
The numbers which are mentioned after TILT=NONE explain several terms related to the specification of light like “number of light sources,” “horizontal angle measurement quantity,” “multiplication factor of light intensity,” “luminous flux lm for every light source,” “Length of light-emitting surface,” “Width of Emitting Surface,” “measurement quantity of vertical angle,” “Type of light distribution curve like Type A= 3, Type B= 2, Type C= 1”, “Type of length unit like Inch foot = 1, Metric m = 2”, “Height of Emitting Surface.”
Part 3: Test Data
The angle should be measured vertically whenever the corresponding numbers start from 0.0. To that, the other angle is measured horizontally. However, you should measure each point of it to check out the intensity of the light sequences.
Example: A maximum print of 10 degrees has been taken as the test interval concerning the test of the vertical 0~180 degrees. However, if horizontal 0~360 degrees are considered, then every 90 degrees will be the test interval. Let X be the intensity of light that has been assessed at each point is X. The test reports obtained during the breaks are 0.0, 10.0, 20.0, 30.0, 40.0, 50.0, 60.0, 70.0, and so on.
Decoding Luminous Intensity Distribution Report
After decoding everything about the IES, it’s time to have a precise idea about the next step, which is the LID (Luminous Intensity Distribution) report.
Luminous Intensity Distribution Diagram
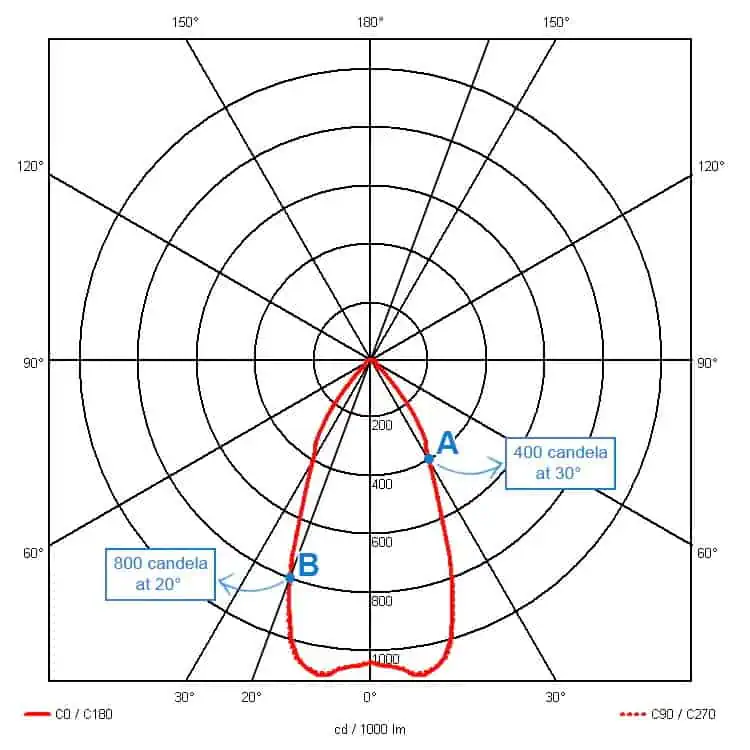
Through the Luminous Intensity Distribution Diagram, one can point out the junctures crucial for light intensity. With the help of this diagram, it’s pretty prominent that the power of light distribution, which is present in three-dimensional space, can be implied in two-dimensional polar coordinates.
However, one can consider the center of the light source for the polar origin. Through four vertical angles, you can easily measure the luminosity along with broadening the maximum light intensity value present on each curve.
Light Distribution Curve
A visual articulation of light when any source of light disseminates it can be expressed as a light distribution curve. However, both three-dimensional and two-dimensional concepts are the major ingredients to get the notions of this curve.
A slight glance at the light distribution curve may appear to be an arduous intuition. But as soon as you clear out the concept about the basic terms of it, the curve will surge as an easy wave.
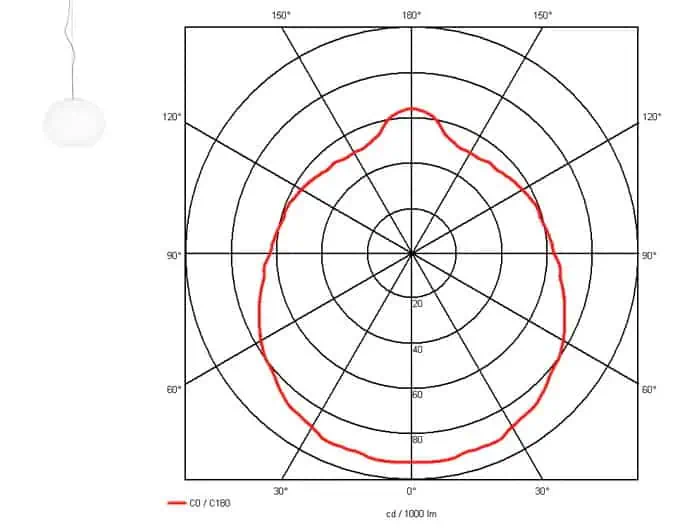
Symmetrical Light Distribution
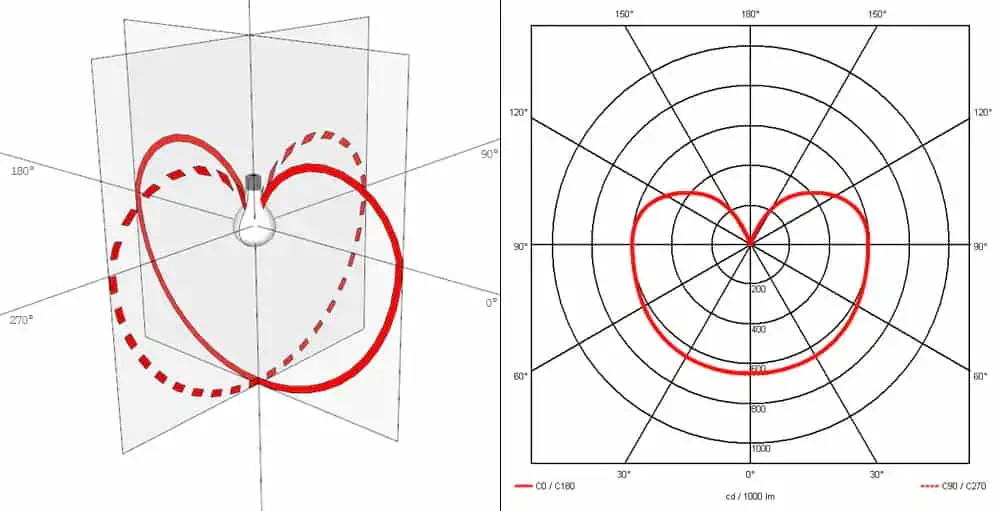
In symmetric light distribution, every light beam is dispersed evenly in all directions. However, the intensity of the light is distinct from various angles. Solid and dotted lines can express the rays which are scattered. The solid line will indicate the frontal view, whereas the dotted line will express the side view.
Nonetheless, the entire structure of both the lights is similar, but still, they work differently when it comes to frontal or side view. These lines also tend to overlap as they are evenly dispersed in all directions.
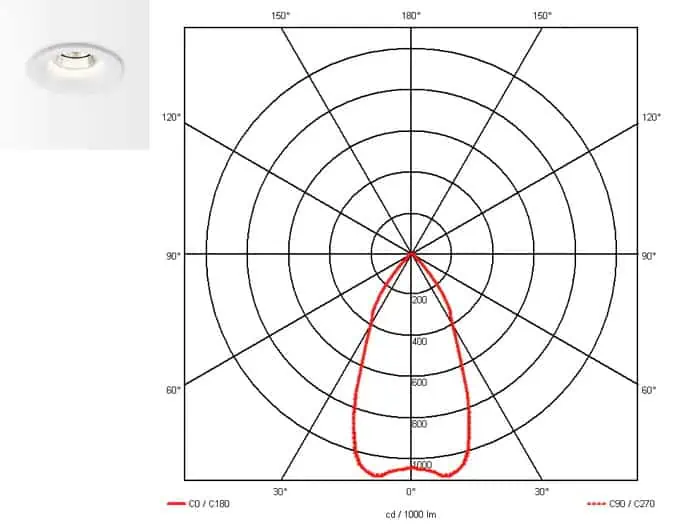
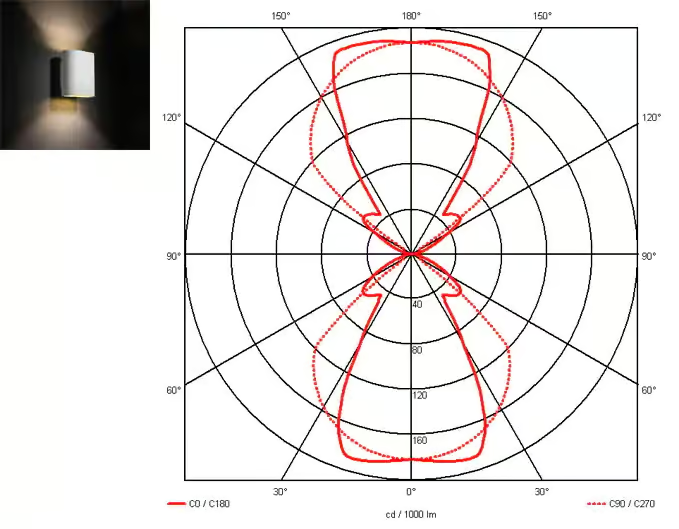
Asymmetrical Light Distribution
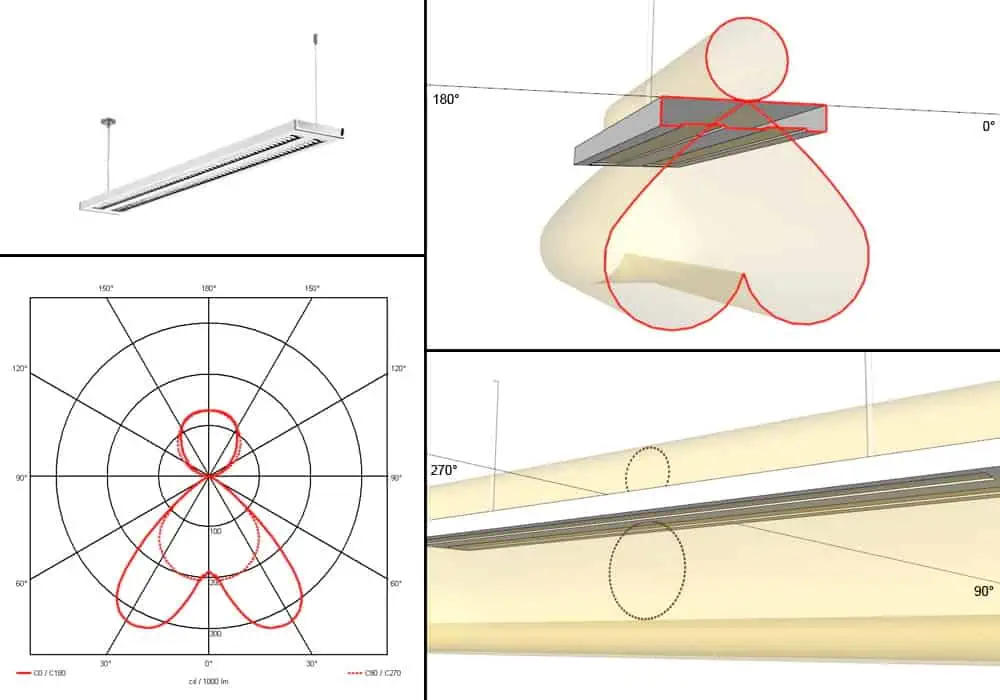
When the glares of light from a particular light source are distributed sideways or in one direction, then it can be termed asymmetric light distribution. If you observe the luminaire, it will state that you are standing opposite it with an axis of 0-180°.
After observing the luminaire precisely, you will get to know about a spherical plane from the upward beams and two spherical planes from the downward beam. However, this states that he was a spherical beam split into two. All these eleven distributions are happening concerning the inbuilt reflector, which is hindering the light at the center.
Some Examples To Consider
- DeltaLight Reo
The frontal and the side view of two distinctive curves overlapping each other describe the DeltaLight Reo. However, the beams won’t be scattered in diverse directions.
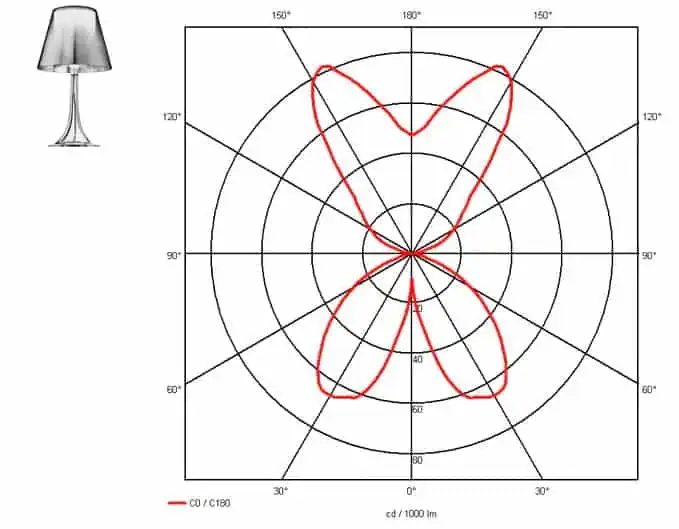
- Flos Glo-Ball
Flos Glo-ball is the spheroidal-shaped source of light that acquires the capability to light up and down. In the concept, two curves tend to overlap each other at a particular juncture. To be more explicit, the glares disperse symmetrically.
- Modular Lighting Duell
Looking straight at a particular wall, one can easily figure out an upward and downward beam formed from the light source. As a result of this, the glare can reflect in the solid red line. From the side, this particular line explains the light distribution methodology. With this identifying the same structure of the top and bottom curves are lenient.
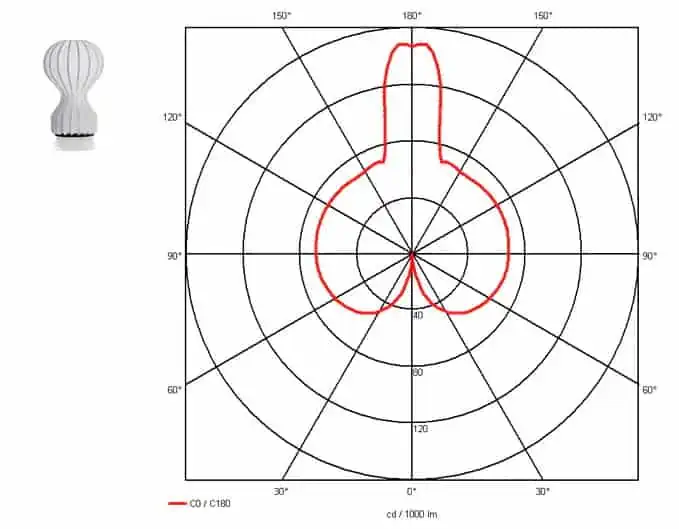
- Flos Miss K
The Type of table lamp where the vision of the distribution of light looks identical or equivalent is known as the Flos Miss K table lamp. The curves overlap, and the beams scatter in two different planes, both up and downwards. The split in the downward glare as the light source can’t illuminate light directly.
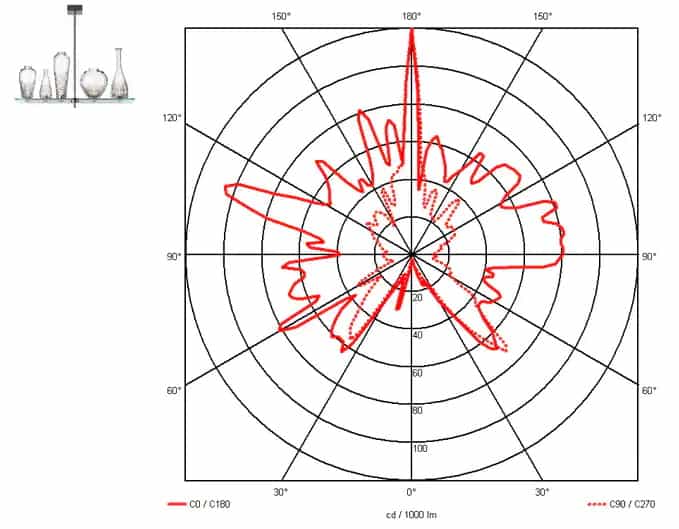
- Flos Cicatrices de luxe
The beams which are scattered through the glass vases are indifferent. This is because the elections withstood the stars’ shape in the light distribution curve.
- Flos Gatto
In the Flos Gatto table lamp, a symmetric light distribution concept can be obtained where two curves cross each other. However, the beams of light disperse both upwards and downwards accordingly.
UGR Table (Unified Glare Rating)
The UGR table indicates the UGR values, which can be calculated by specific software. It’s calculated after having complete information on the size of the room, light dispersion of the light source, radiance parameters, and reactivity.
Looking at the table, you will get several alphabets highlighting certain specifications.
H: the distance between the horizontal line of the human eye and the horizontal line of the installation position of the positioned lamp
X: the width of the room
Y: the length of the room
More information, you can read What is Anti-Glare Light and How To Reduce Light Glare?
Average Illuminance Effective Diagram
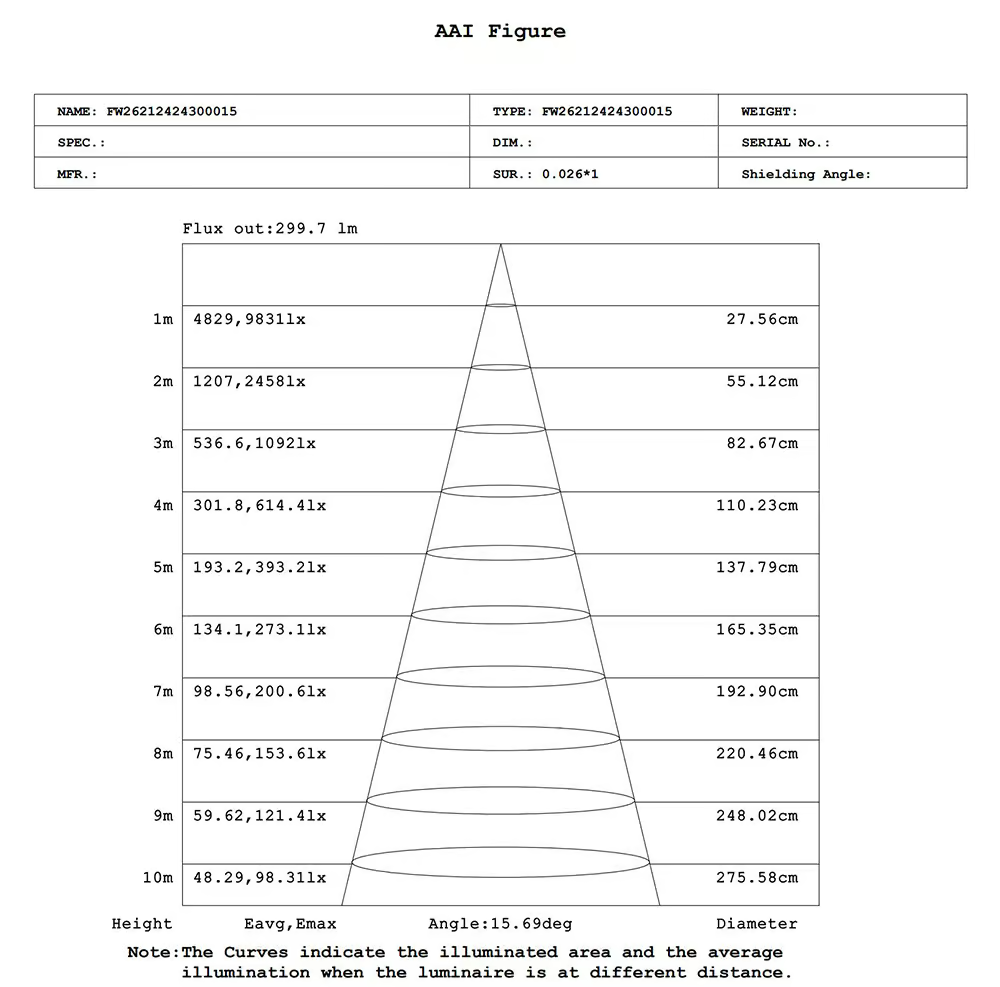
The average helpful illuminance diagram is one illustration through which gathering information about the IES report is much easier. If you look into this diagram, you can identify the lamp’s height and light-emitting angle and easily calculate the Eavg and Emax.
Height 1m~10m on the left side: The distance between the observation surface and the light-emitting surface of the lamp
Diameter on the right side: It’s the spot diameter of the observation surface. With this, you can calculate the the spot size.
Eavg, Emax: The average illuminance of the observation surface and the maximum central illuminance.
Angle: It’s the size of the beam angle, and its unit is “°.”
Luminaire Photometric Test Report
Before investing in any light-emitting sources, people generally try to figure out the source’s quality or spatial distribution. It’s one of the most crucial steps before investing. However, Luminaire Photometric Test Report is one report that assists people with the quality mentioned earlier in the source.
Photometric Testing put forward the precise idea of providing a comprehensive laboratory service for testing the amount, color, spatial distribution, and quality of light radiating from the light sources, LEDs, lamps, and so on.
Zonal Flux Diagram
The manufacturers are the prominent people involved in obtaining the zonal flux diagram of the source light. However, the zonal flux diagram considers the overall changes and transitional zones.
This diagram is composed of a coordinate system for two angles. However, the vertical and azimuth angles are the two crucial junctures for this particular diagram.
Luminance Limitation Curves
The luminance limiting curves of the source of light depict numerous classes of it. However, the types express the specialty rather than the specifications of the source of light. Class A illustrated the general points, particularly about every individual’s requirements.
It’s imperative to have a direct indication of the vision or the glance that anyone can acquire before considering the light source. However, the positions of the curves formulated during the emitting indicate the range and depth of the source.
CU and Luminaire Budgetary Estimate Diagram
A coefficient of utilization (CU) is used to measure the efficiency of the luminaire concerning the luminous energy when it is transferred to a particular operating plane. However, CU is represented as the proportion of the luminous inconstancy in a working area whenever a specific light source emits it. However, CU is crucial in designing an energy-efficient Controlled Environment Agriculture (CEA) facility.
WEC and CCEC
The WEC and CCEC tables are used for an indoor luminaire in lighting design. They’re short for Wall Existence Coefficients and Ceiling Cavity Existence Coefficients. These coefficients help determine the amount of light the source emits inside the room. The WEC & CCEC also help determine how much light gets reflected by the room’s walls, ceiling, and floor.
Utilization Factors Table
The utilization factor represents the ratio of the total amount of lumens that have been received in the established plane. The established plane is where the work is done simultaneously to the total amount of lumens emitted by the light source.
However, this proportion of the sources is expressed in UF = Lumens received on the Working Plan / Lumens output of luminaires. The utilization factor table points out the ratio of numerous unitization factors to set down the contrast among them.
Isocandela Diagram
The isocandela curve diagram is an alternative or an exact representation of the luminous flux distribution. This diagram is set up to forward the identification of the intensity of the sources. It’s presented on an exterior surface as isocandela curves. The obtained from the angle are measured in candelas per square meter (cd/m2).
AAI Figure
AAI figure is a graphical representation of the illuminated area versus the average illumination. However, this contrast has been set whenever the luminaire is established at varying extents. The Beam Angle is formed concerning a given angle/area in the diagram. Nonetheless, this clearly expresses the extended flux created but not represented in the data.
Isolux Diagram
An isolux diagram is also known as an isofootcandle. Various illuminance values are plotted through this diagram to determine the coordinates on the given surface. However, you can put this diagram forward to illustrate the characteristics of the distribution of the luminaire. However, it also elevates the themes to determine the lighting levels.
LED Avg. L Report
In LED avg. L report “L” represents the percentage of lumen correlated with the initials of the lumens. However, some or the other way, the report illustrates the working duration of any light source. The report explains whether the light sources can match the average luminous efficacy.
Planar Illuminance Curve
When it comes to optical microscopy, the illumination system plays a vital role. The illumination system helps transition light through a translucent object which assists in viewing the placed thing. However, this illumination system affects the sample while considering or after that.
Nonetheless, the plane illuminance curve elaborates how this stray works and fulfills the viewers’ demand while viewing under an optical microscope.
Luminous Distribution Intensity Data
The luminous intensity distribution data illustrates the measurement of a luminous intensity along the luminaire intensity. However, if the luminaire is scattered, the luminous flux will move in all directions without any obstruction. This distribution is set up in a graphical way to represent the curves wormed by gdb luminaire intensity.
Where Is the IES Report Used?
IES reports are pictorial methods to point out that the entire lighting protocol of the lamp is evenly allocated in a particular room. However, the experts in this business join the pictures of the reports to distribute the lighting protocol evenly.
On the other hand, it’s not necessary to put each point of the report in the correct position through the trial and error method. However, sometimes the entire procedure seems to be difficult and inconvenient.
However, the python technique is the most convenient way to read the data, as illustrated in the IES report. By clicking just MD5, one can easily assign data to every manufacturer without hassle. Along with this, duplicate data or information will also get removed. After this process, only the fundamental, error-free data will be there.
After this, it’s evident that one can easily create a phenomenon in Blender. Each specification can be incorporated, like the length required to hang the light sources and the length necessary above the floor. All of these are possible with the help of python.
Before putting everything in place, previewing is essential. Measuring the maximum and minimum brightness of the light sources, adjusting the intensity of the light, and so on should be done before the final verdict.
IES Vs. LDT
- LDT format is the main ingredient in the lines that specify the correlated color temperature (CCT) and the color rendering index (CRI). In contrast, the IES file doesn’t illustrate anything about such data.
- LDT mainly contains essential information about the source of light. This information includes the lamp configuration, the luminous intensity, etc. However, the IES files explain how a light source will distribute the light in a room.
Through these files, the manufacturers figure out the rational version of the lights and how the project will look after the final touch-up. 3D artists use this data to put all the plots about the images and the lights to present them more precisely and realistically.
More Ways To Read IES File On Computer?
Generally, for opening any IES reports, Microsoft Notepad and Microsoft Wordpad are essential. Apart from these two primary applications, there are other applications in which one can opt to open the IES reports.
Such compatible applications or software include:
- Photometrics Pros
- Photometric Toolbox
- Autodesk’s Architecture
- Revit software
- RenderZone
- Visual lighting software
- Photopia.
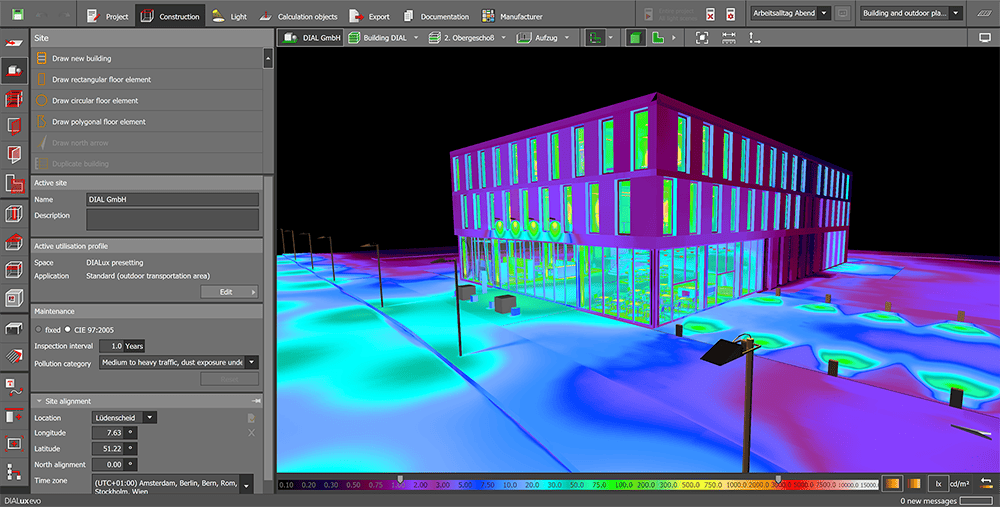
- DIALux
Nowadays, numerous applications and software demand money or subscription before serving the user. That’s why people are very interested in those applications and software that don’t require a single penny from the user before or after custom. Such applications are
- IES Viewer
- LITESTAR 4D Open
- Visual Photometric Tool
However, using any other kind of application can hamper the entire formatting or presentation of the file, which is used to provide a schematic representation of the content present in the report.
Converting An IES File
It’s elementary to convert an IES file; all you need is a EULUMDAT file (.LDT). One can easily use this converter online at the website of the app spot without any extra charges. However, conversion of LDT to IES files is also possible through this.
Apart from this, Eulumdat Tools is another tool that also does the same work as the prior one. PhotoView is another converter that needs extra charges during the conversion procedure.
You can open the DIALux program in the Unified Luminaire Data files without any. You can quickly convert IES files into ULD files through this application.
More Tweaks To Open IES File
If you still can’t open the IES files with the applications mentioned above and the software, you need some other tricks to get it. If the IES files only contain either the Xilinx ISE Project files or the InstallShield Express Project files, then you have to use either InstallShield or ISE Design Suite to open the file.
However, if you are confused with the EIP files and can’t open them, it’s highly possible that Capture One must develop the images of the files.
FAQs
Conclusion
Each section of this article conveys the crucial points created for the IED reports. Hopefully, the content will clear out the audience’s vision about IES reports and some other related issues.
LEDYi manufactures high-quality LED strips and LED neon flex. All of our products go through high-tech laboratories to ensure the utmost quality. Besides, we offer customizable options on our LED strips and neon flex. So, for premium LED strip and LED neon flex, contact LEDYi ASAP!