There are various led strip lights on the market, and these led strip lights come from different manufacturers. When we purchase led strips, how do we judge the quality of the led strips? One of the most straightforward methods is to ask the LED strip manufacturer for an “integrating sphere test report”. By reading the integrating sphere test report, you can quickly know the various parameters of the product to evaluate the quality of the product preliminarily. Since the integrating sphere test report contains many parameters, many people may not understand it. This article will explain each parameter in the integrating sphere test report. I believe that after reading it, you can easily understand the integrating sphere test report in the future. So let’s get started.
What is An Integrating Sphere?
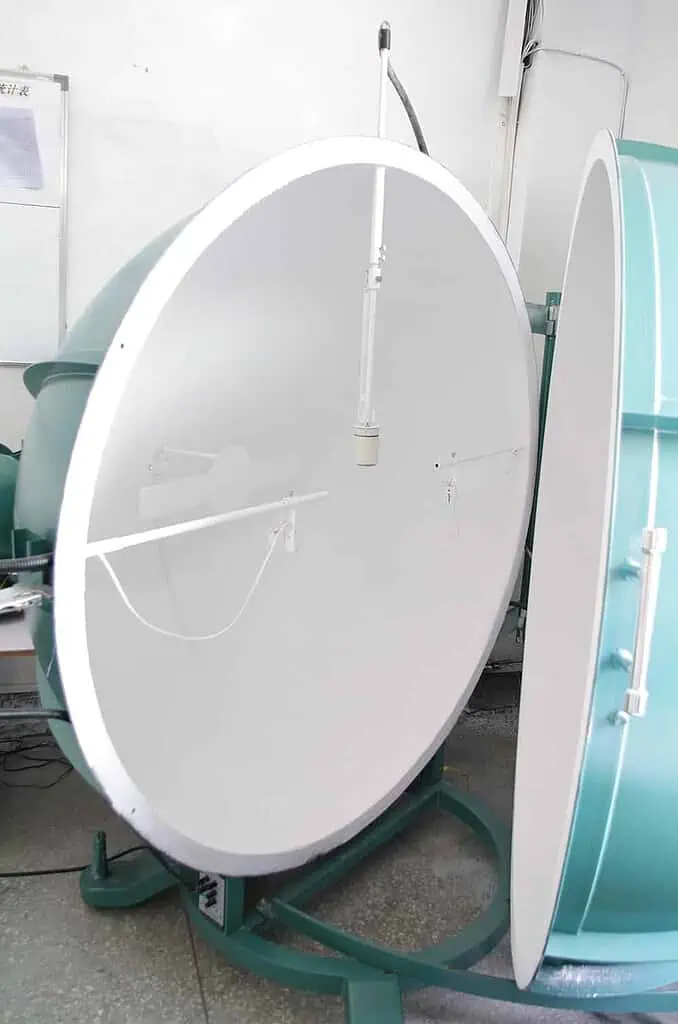
An integrating sphere (also known as an Ulbricht sphere) is an optical component consisting of a hollow spherical cavity with its interior covered with a diffuse white reflective coating, with small holes for entrance and exit ports. Its relevant property is a uniform scattering or diffusing effect. Light rays incident on any point on the inner surface are, by multiple scattering reflections, distributed equally to all other points. The effects of the original direction of light are minimized. An integrating sphere may be thought of as a diffuser which preserves power but destroys spatial information. It is typically used with some light source and a detector for optical power measurement. A similar device is the focusing or Coblentz sphere, which differs in that it has a mirror-like (specular) inner surface rather than a diffuse inner surface. If you want to know more detail, please visit integrating sphere.
Integrating Sphere Test Report
The picture below is a test report from our factory integrating sphere. As you can see, the integrating sphere test report is mainly divided into seven parts.
- Header
- Relative Spectral Power Distribution
- Color Consistency Macadam Ellipse
- Color Parameters
- Photometric parameters
- Instrument Status
- Footer
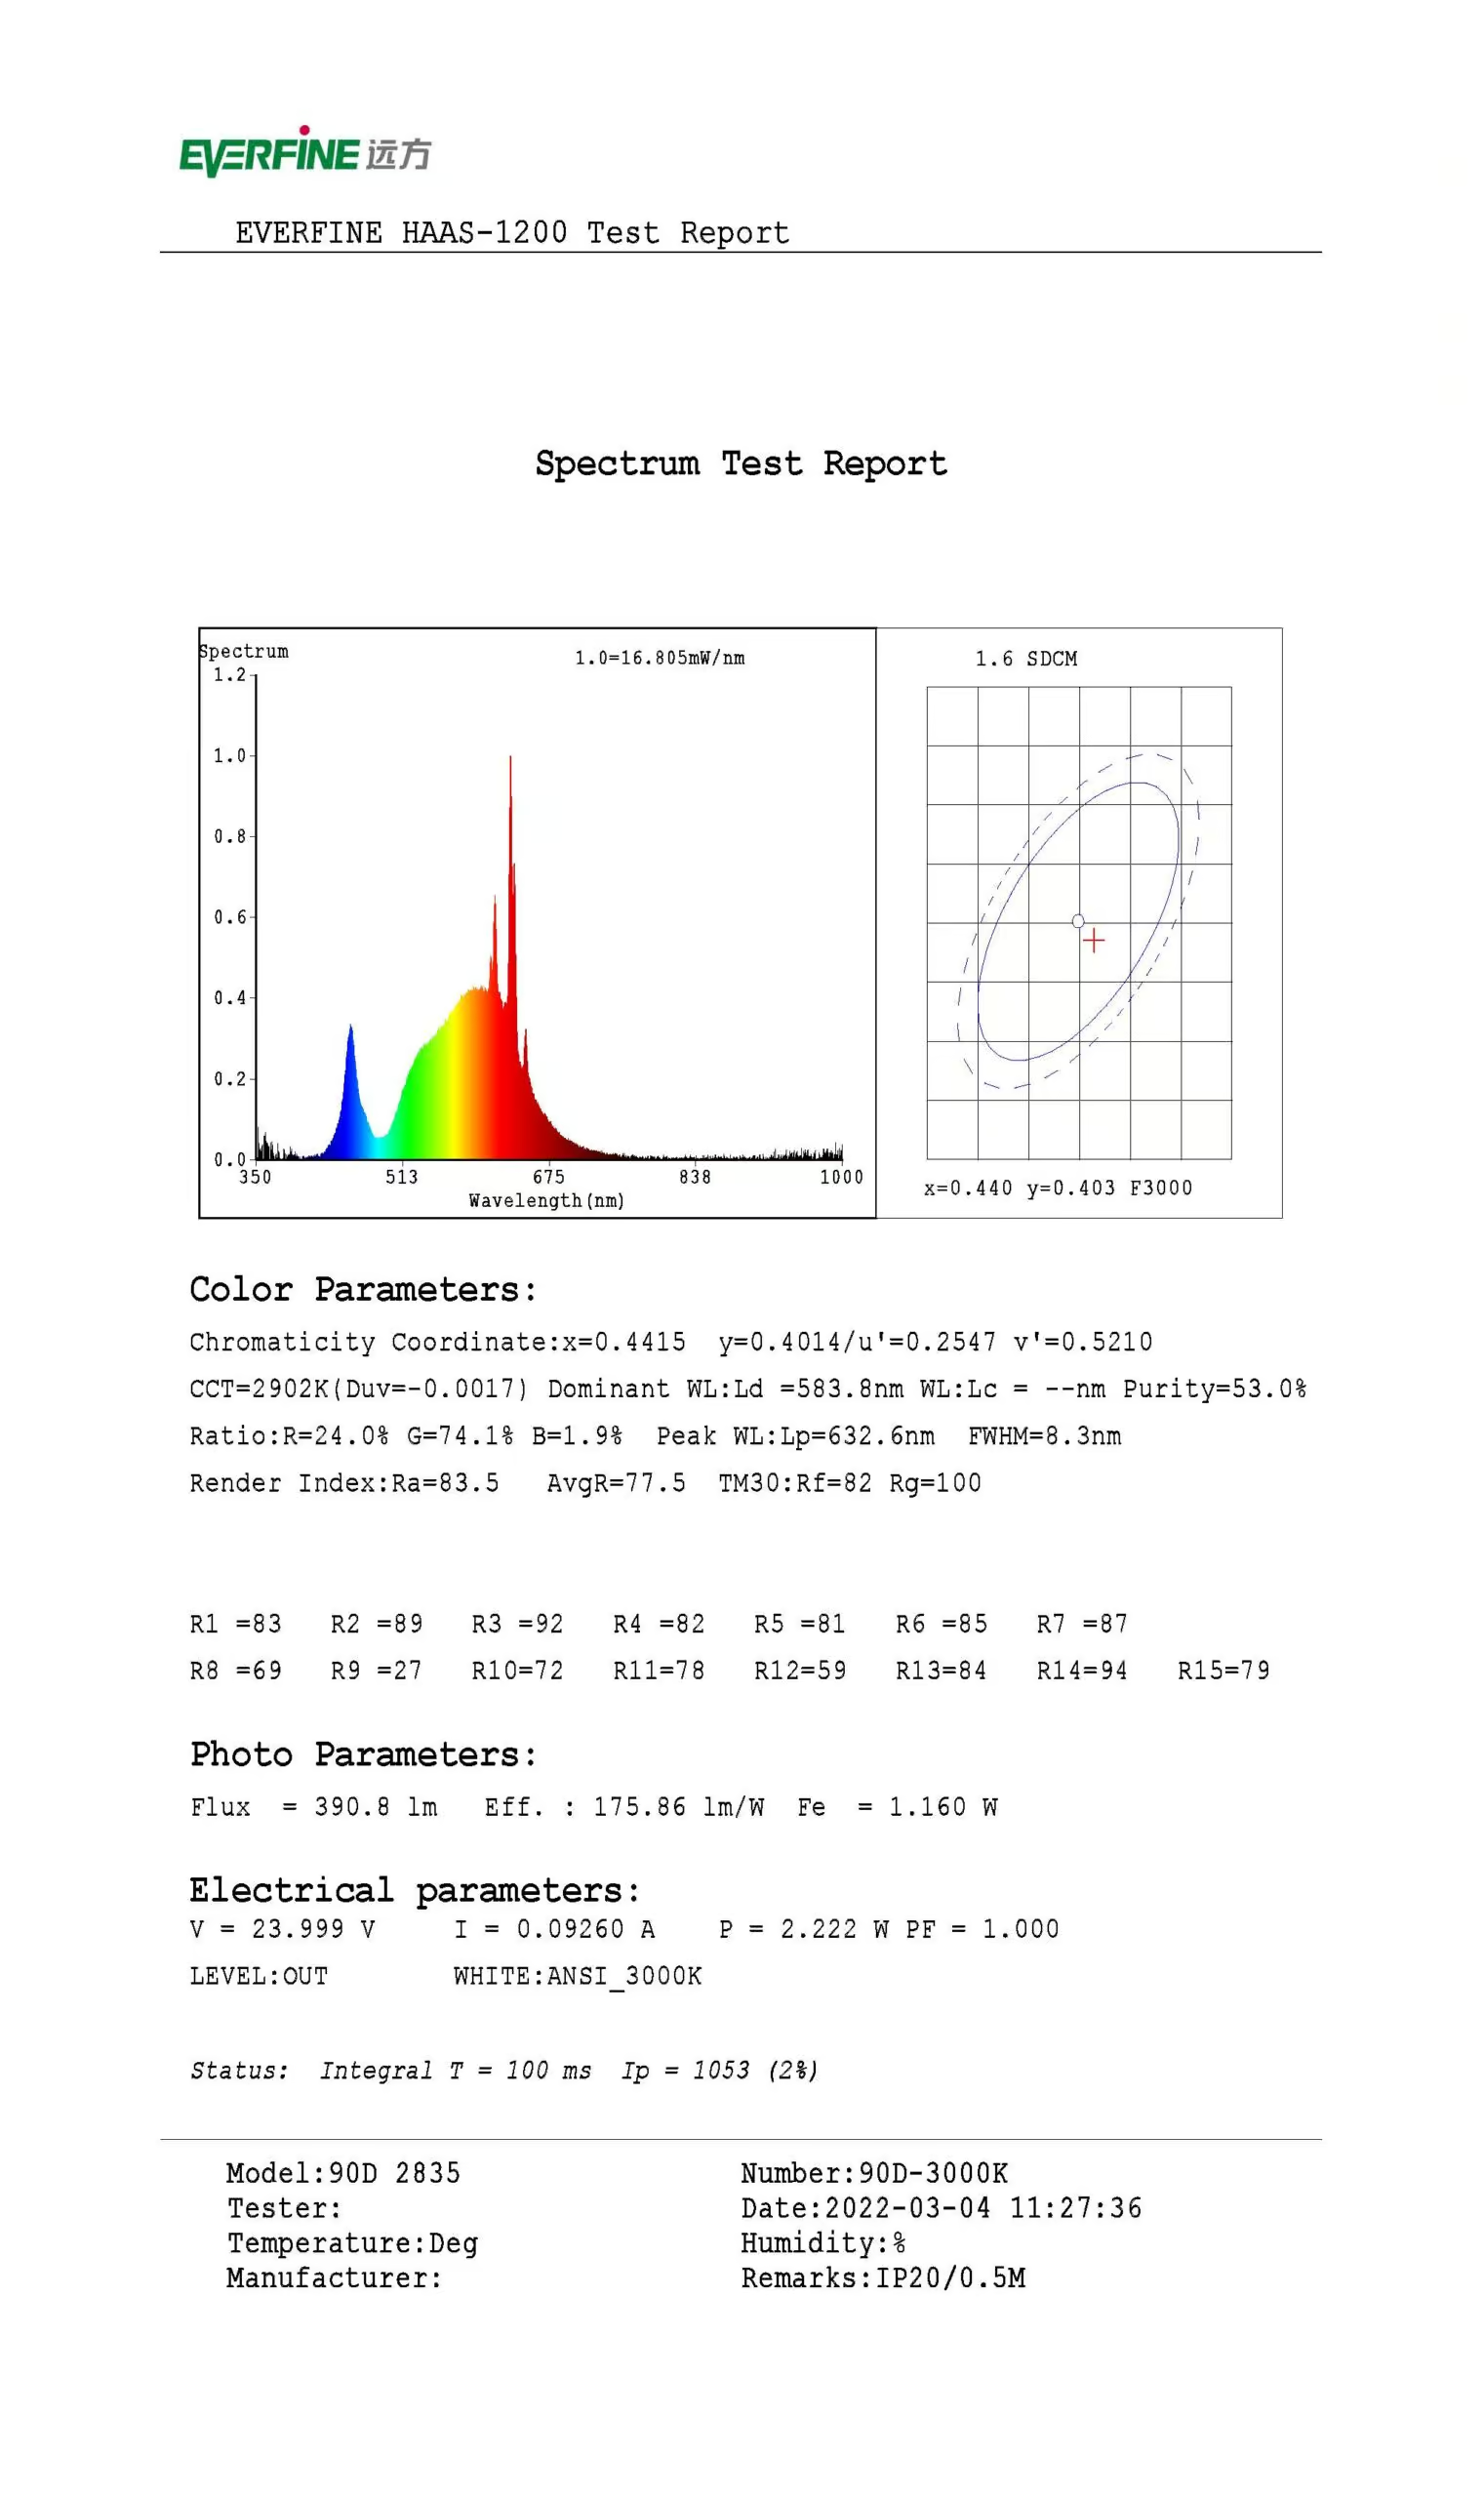
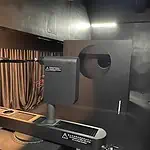
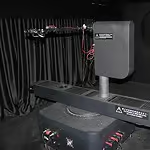
1. Header
The header has the brand and model information of the integrating sphere. The brand of our company’s integrating sphere is EVERFINE, and the model is HAAS-1200. EVERFINE Corporation (Stock Code: 300306) is a professional supplier of photoelectrical (optical, electrical, opto-electronical) measurement instrument and calibration service, and leading in the field of LED & lighting measurement instrument. EVERFINE is a National Certificated High-tech Enterprise, Supportive Member of the CIE, ISO9001 Registered Firm, Government Certificated Software Enterprise & Software Product Enterprise, and owns a Province Level High-tech R&D Center, and NVLAP accredited Lab (Lab code 500074-0) and CNAS accredited Lab (Lab code L5831). In 2013 and 2014, EVERFINE was judged by Forbes as China’s Most Potential Listed Companies.
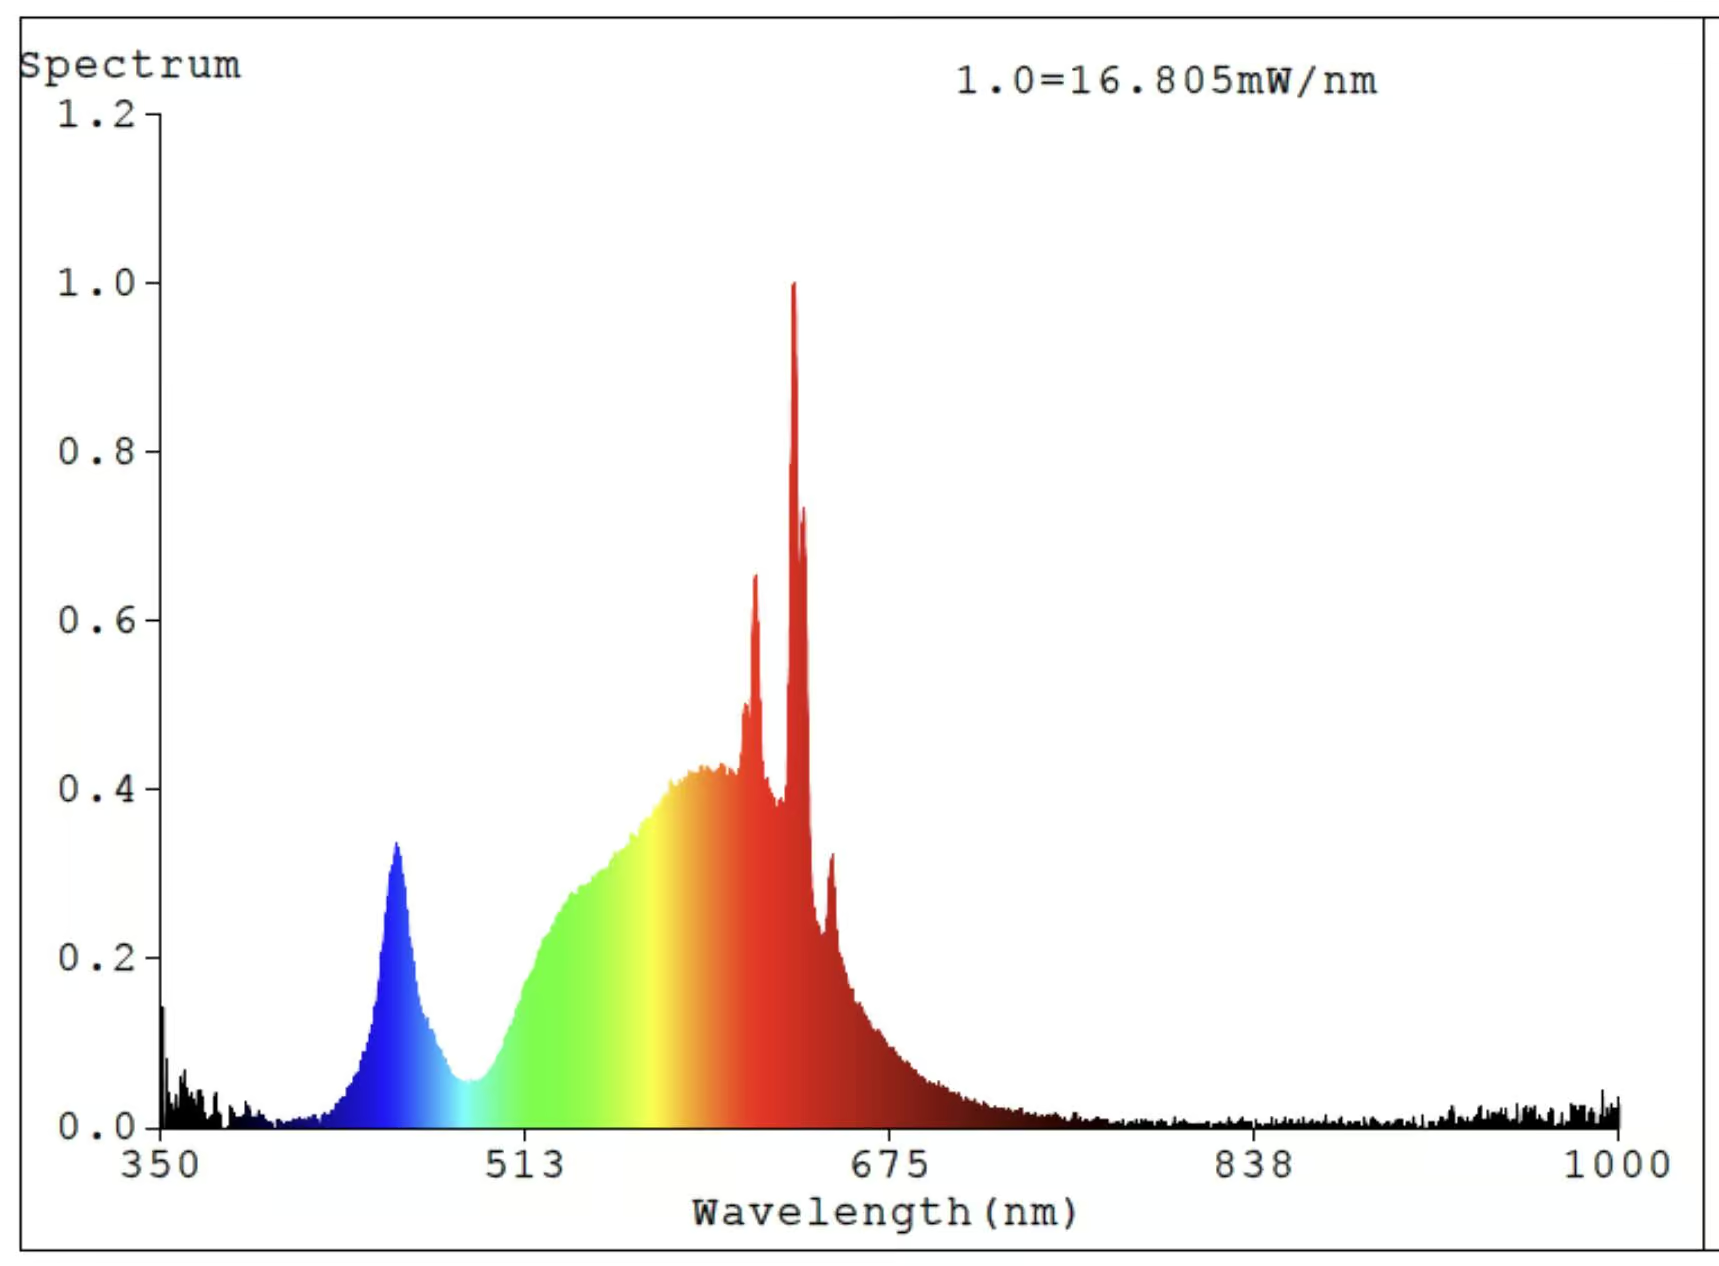
2. Relative Spectral Power Distribution
In radiometry, photometry, and color science, a spectral power distribution (SPD) measurement describes the power per unit area per unit wavelength of an illumination (radiant exitance). More generally, the term spectral power distribution can refer to the concentration, as a function of wavelength, of any radiometric or photometric quantity (e.g. radiant energy, radiant flux, radiant intensity, radiance, irradiance, radiant exitance, radiosity, luminance, luminous flux, luminous intensity, illuminance, luminous emittance).
Relative Spectral Power Distribution
The ratio of spectral concentration (irradiance or exitance) at a given wavelength to the concentration of a reference wavelength provides the relative SPD. This can be written as:
For instance, the luminance of lighting fixtures and other light sources are handled separately, a spectral power distribution may be normalized in some manner, often to unity at 555 or 560 nanometers, coinciding with the peak of the eye’s luminosity function.
3. Color Consistency Macadam Ellipse
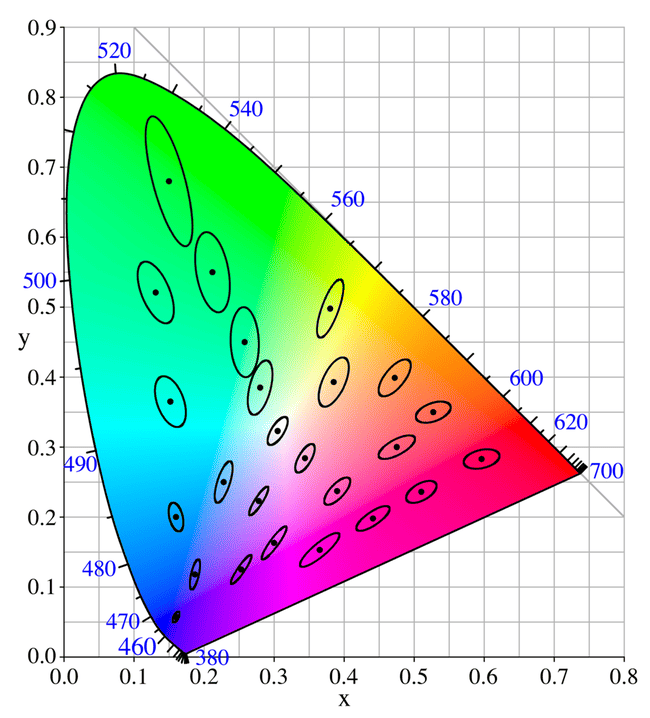
Color consistency is evaluated in terms of MacAdam ellipses, defined in the 1930s by David MacAdam and others to represent a region on a chromaticity diagram that contains all colors that are indistinguishable by the average human eye from the color at the center of the ellipse.
MacAdam’s experiments relied upon visual observation of the so-called Just Noticeable Colour Difference (JND) between two very similar colored lights. Just Noticeable Difference is defined as the color difference where 50% of observers see a difference and 50% of observers do not see a difference. The zones with standard deviations of color matching (SDCM), were found to be elliptical in the CIE 1931 2 deg observer color space. The size and orientation of the ellipses varied greatly depending upon the location in the color space diagram. The zones were observed to be largest in the green and smaller in the red and blue.
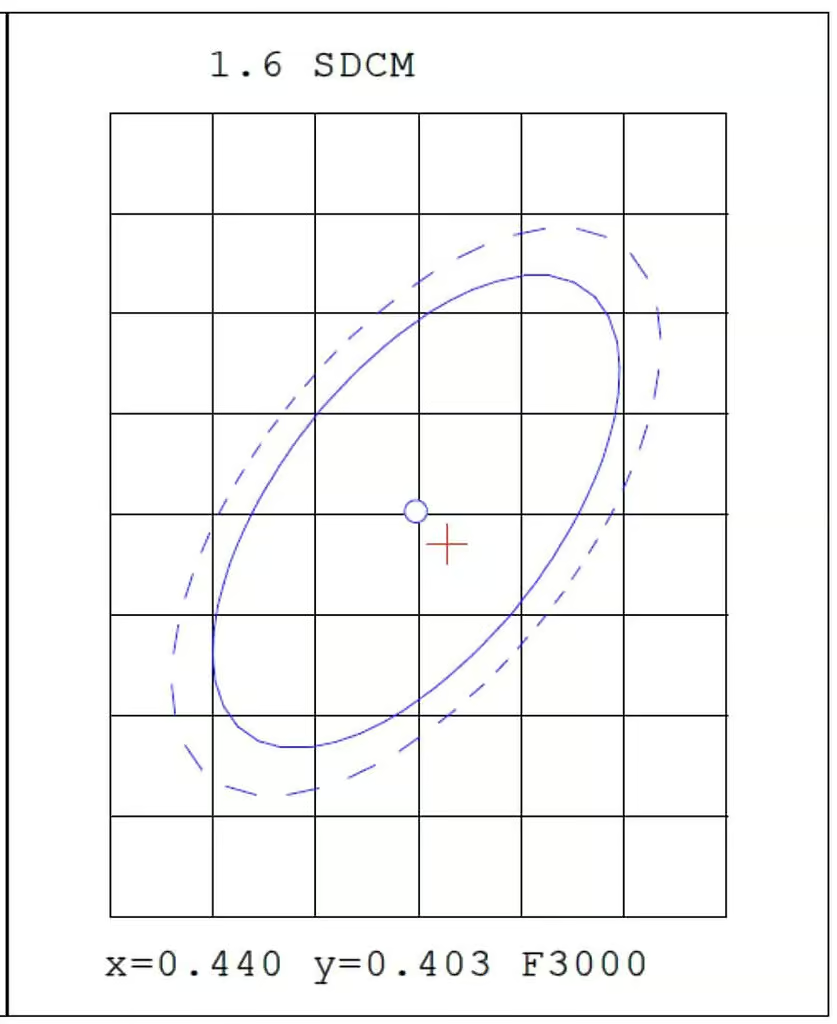
Due to the variable nature of the color produced by white light LEDs, a convenient metric for expressing the extent of the color difference within a batch (or bin) or LEDs is the number of SDCM (MacAdam) ellipses steps in the CIE color space that the LEDs fall into. If the chromaticity coordinates of a set of LEDs all fall within 3 SDCM (or a “3-step MacAdam ellipse”), most people will fail to see any color difference. If the color variation is such that the variation in chromaticity extends to 5 SDCM or a 5-step MacAdam ellipse, you will start to see some color difference. You can see the color consistency is 1.6SDCM from the test report. And there is “x=0.440 y=0.403 F3000” on the bottom, means the center point of the ellipse is “x=0.440 y=0.403”.
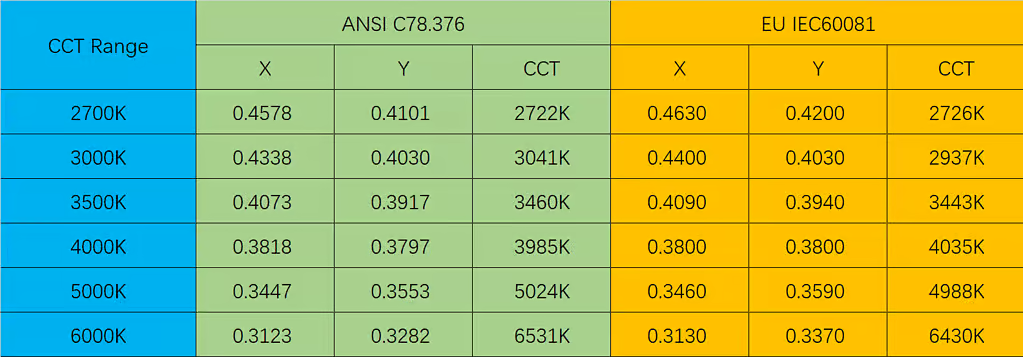
Color Tolerance Main Standard Category
At present, the main color tolerance standards on the market are North American ANSI standards, European Union IEC standards, and their corresponding color tolerance center points are summarized as follows:
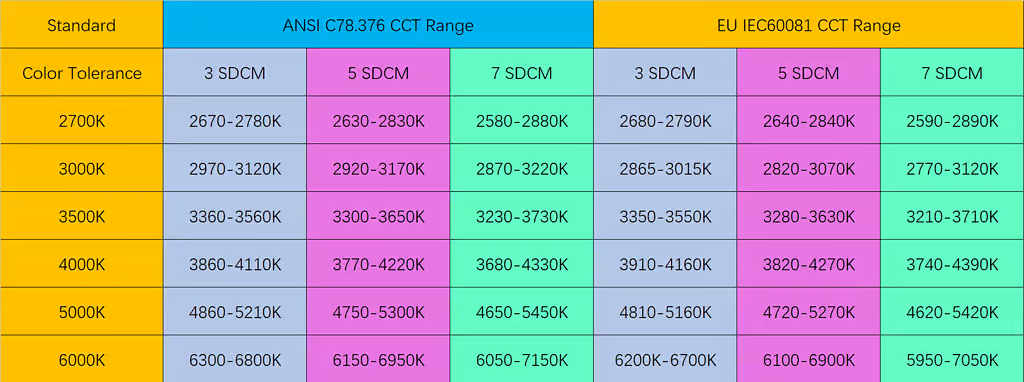
CCT range corresponding to correlated color tolerance
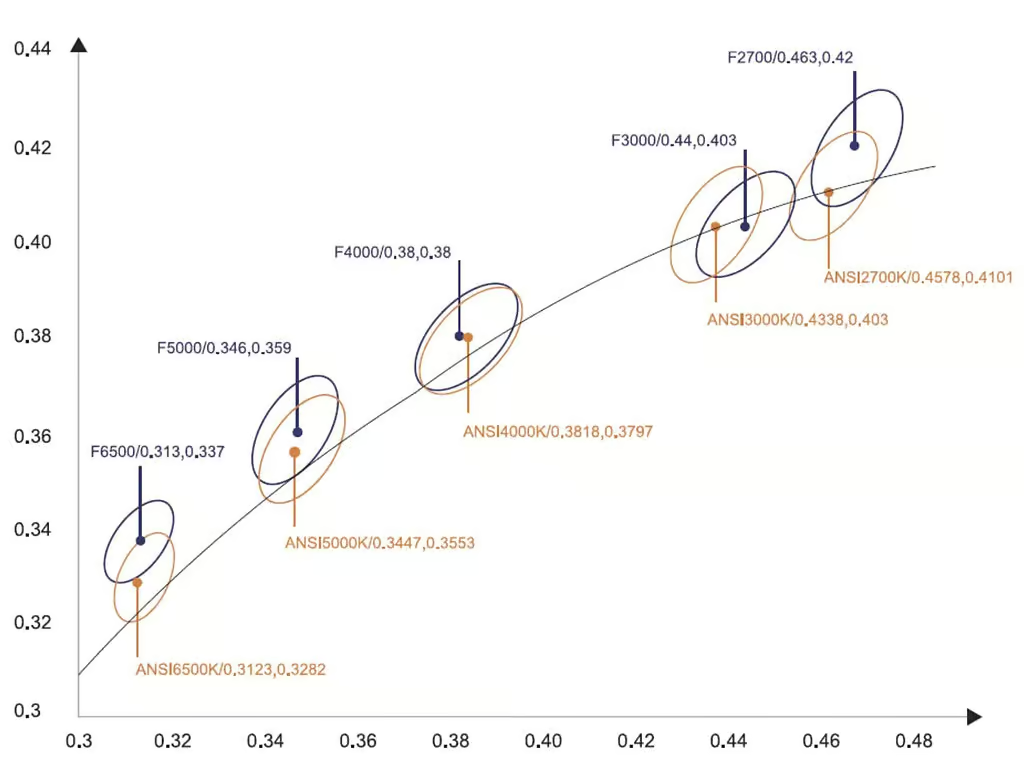
3-SDCM Schematic diagram comparing IEC standard and ANSI standard
4. Color Parameters
The Color Parameters section mainly contains Chromaticity Coordinate, CCT, Dominant Wavelength, Peak Wavelength, Purity, Ratio, FWHM, and Render Index(Ra, AvgR, TM30:Rf, TM30:Rg).
Chromaticity Coordinate
The CIE 1931 color spaces are the first defined quantitative links between distributions of wavelengths in the electromagnetic visible spectrum, and physiologically perceived colors in human color vision. The mathematical relationships that define these color spaces are essential tools for color management, important when dealing with color inks, illuminated displays, and recording devices such as digital cameras. The system was designed in 1931 by the “Commission Internationale de l’éclairage”, known in English as the International Commission on Illumination.
The CIE 1931 RGB color space and CIE 1931 XYZ color space were created by the International Commission on Illumination (CIE) in 1931.[1][2] They resulted from a series of experiments done in the late 1920s by William David Wright using ten observers[3] and John Guild using seven observers.[4] The experimental results were combined into the specification of the CIE RGB color space, from which the CIE XYZ color space was derived.
The CIE 1931 color spaces are still widely used, as is the 1976 CIELUV color space.
In the CIE 1931 model, Y is the luminance, Z is quasi-equal to blue (of CIE RGB), and X is a mix of the three CIE RGB curves chosen to be nonnegative (see § Definition of the CIE XYZ color space). Setting Y as luminance has the useful result that for any given Y value, the XZ plane will contain all possible chromaticities at that luminance.
In colorimetry, the CIE 1976 L*, u*, v* color space, commonly known by its abbreviation CIELUV, is a color space adopted by the International Commission on Illumination (CIE) in 1976, as a simple-to-compute transformation of the 1931 CIE XYZ color space, but which attempted perceptual uniformity. It is extensively used for applications such as computer graphics which deal with colored lights. Although additive mixtures of different colored lights will fall on a line in CIELUV’s uniform chromaticity diagram (dubbed the CIE 1976 UCS), such additive mixtures will not, contrary to popular belief, fall along a line in the CIELUV color space unless the mixtures are constant in lightness.
CCT
Color temperature (Correlated Color Temperature, or CCT, in lighting tech jargon) is essentially a gauge of how yellow or blue the color of light emitted from a light bulb appears. It’s measured in the Kelvin unit and is most commonly found between 2200 Kelvin degrees and 6500 Kelvin degrees.
Duv
What is Duv?
Duv is a metric that is short for “Delta u,v” (not to be confused with Delta u’,v’) and describes the distance of a light color point from the black body curve.
It is typically used in conjunction with a correlated color temperature (CCT) value in explaining how close to the black body curve (“pure white”) a particular light source is.
A negative value indicates that the color point is below the black body curve (magenta or pink) and a positive value indicates a point above the black body curve (green or yellow).
A more positive value indicates a point farther above the black body curve, while a more negative value indicates a point farther below the black body curve.
In short, Duv conveniently provides both magnitude and directional information about a color point’s distance from the black body curve.
Why is Duv important?
Duv is an important metric whenever discussing color sensitive lighting applications, such as film & photography. This is because CCT alone does provide enough information about the exact color.
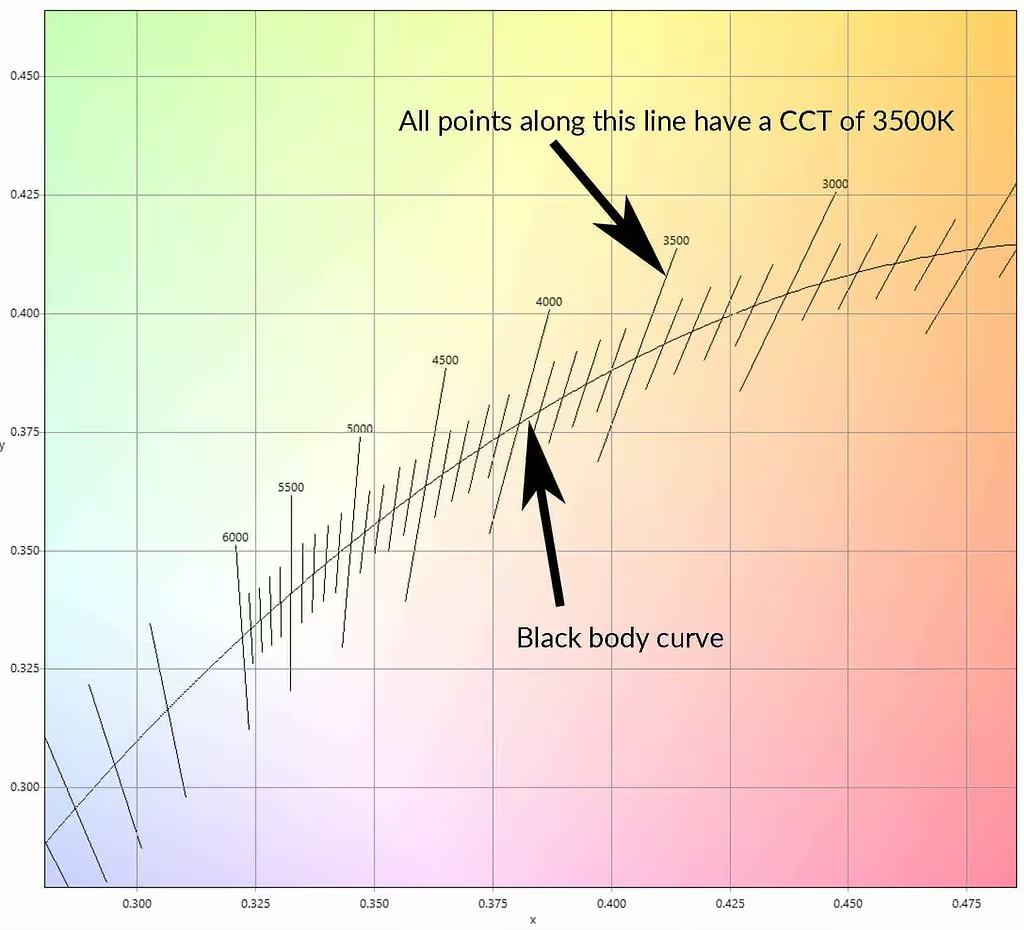
In the graphic below, you will find iso-CCT lines for various CCT values. Iso-CCT lines describe points whose CCT value are the same.
For 3500K, you will see the line extend from a yellowish hue in the area above the black body curve (larger Duv value), while it will transition towards a pink/magenta hue as you move down the same 3500K iso-CCT line below the black body curve (lower, negative Duv value).
In other words, if a lamp has a CCT value of 3500K, in reality, it can be anywhere along this iso-CCT line.
On the other hand, if we were given information that a lamp had a CCT value of 3500K and a Duv = 0.001, this would give us sufficient information to know that it is along the 3500K iso-CCT line, slightly above the black body curve. If and only if both Duv and CCT values are provided, an exact color point can be pinpointed.
Dominant Wavelength
In color science, the dominant wavelength (and the corresponding complementary wavelength) are ways of characterizing any light mixture in terms of the monochromatic spectral light that evokes an identical (and the corresponding opposite) perception of hue. For a given physical light mixture, the dominant and complementary wavelengths are not entirely fixed, but vary according to the illuminating light’s precise color, called the white point, due to the color constancy of vision.
Peak Wavelength
Peak Wavelength – Peak wavelength is defined as the single wavelength where the radiometric emission spectrum of the light source reaches its maximum. More simply, it does not represent any perceived emission of the light source by the human eye, but rather by photo-detectors.
Purity
Color purity is the degree to which a color resembles its hue. A color that has not been mixed with white or black is considered pure. Color purity is a useful concept if you are mixing colors as you want to start with a pure color because this has more potential to create different tones, shades and tints.
Ratio
Ratio refers to the ratio of red, green and blue in the mixed light.
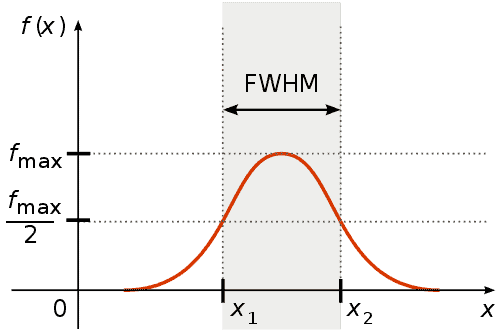
FWHM
In a distribution, full width at half maximum (FWHM) is the difference between the two values of the independent variable at which the dependent variable is equal to half of its maximum value. In other words, it is the width of a spectrum curve measured between those points on the y-axis which are half the maximum amplitude. Half width at half maximum (HWHM) is half of the FWHM if the function is symmetric.
CRI
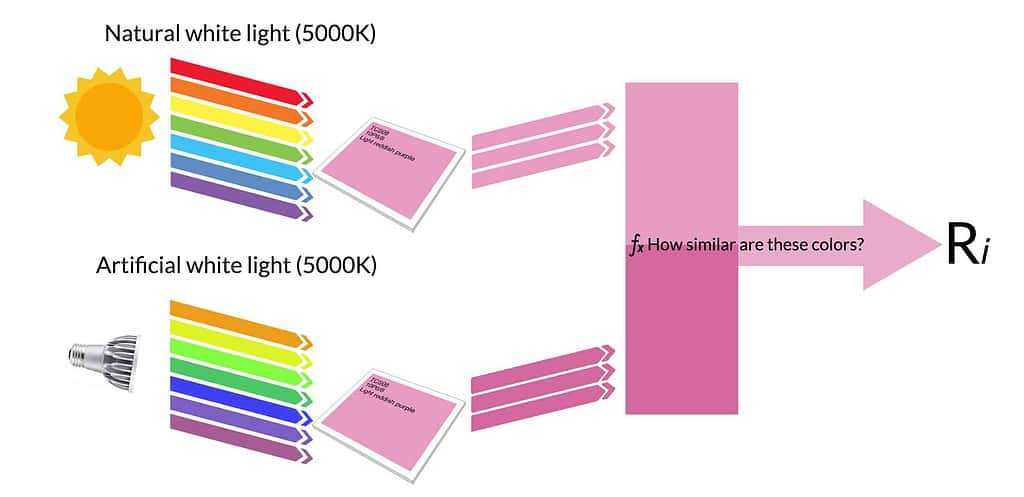
A color rendering index (CRI) is a quantitative measure of the ability of a light source to reveal the colors of various objects faithfully in comparison with a natural or standard light source.
How is CRI measured?
The method for calculating CRI is very similar to the visual assessment example given above, but is done via algorithmic calculations once the spectrum of the light source in question is measured.
The color temperature for the light source in question must first be determined. This can be calculated from spectral measurements.
The color temperature of the light source must be determed so that we can select the appropriate daylight spectrum to use for comparison.
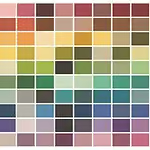
Then, the light source in question will be virtually shone onto a series of virtual color swatches called test color samples (TCS) with the reflected color measured.
There are a total of 15 color swatches:
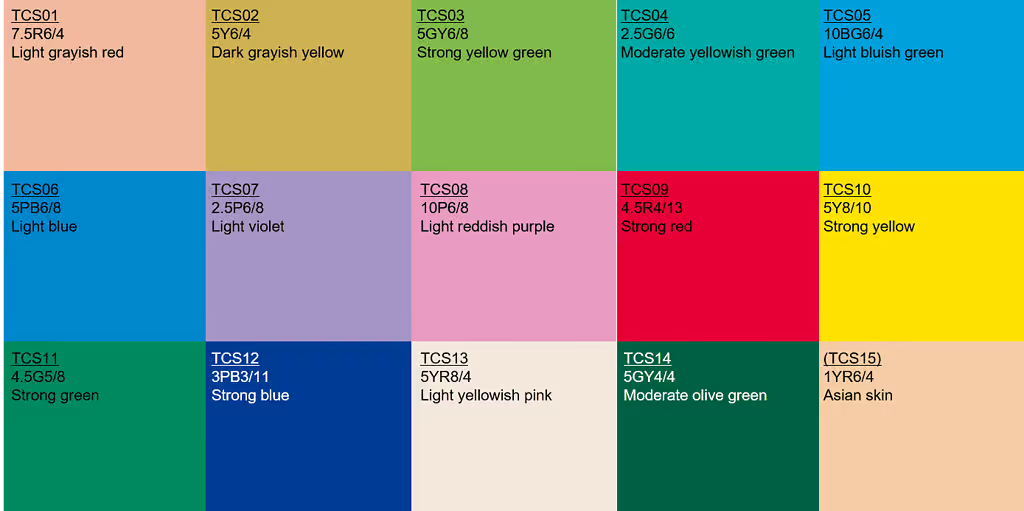
We will also have ready the series of virtual reflected color measurements for natural daylight of the same color temperature. Finally, we compare the reflected colors and formulaically determine the “R” score for each color swatch.
The R value for a particular color indicates the ability of a light source to faithfully render that particular color. Therefore, to characterize the overall color rendering capability of a light source across a variety of colors, the CRI formula takes an average of the R values.
Ra is the average of R1-R8.
AvgR is the average of R1-R15.
TM30
TM30 is a new quality metric that was recently adopted by the IES to supplement and eventually replace the old CRI (CIE) Metric for measuring fidelity of a light source.
Main Components of TM30
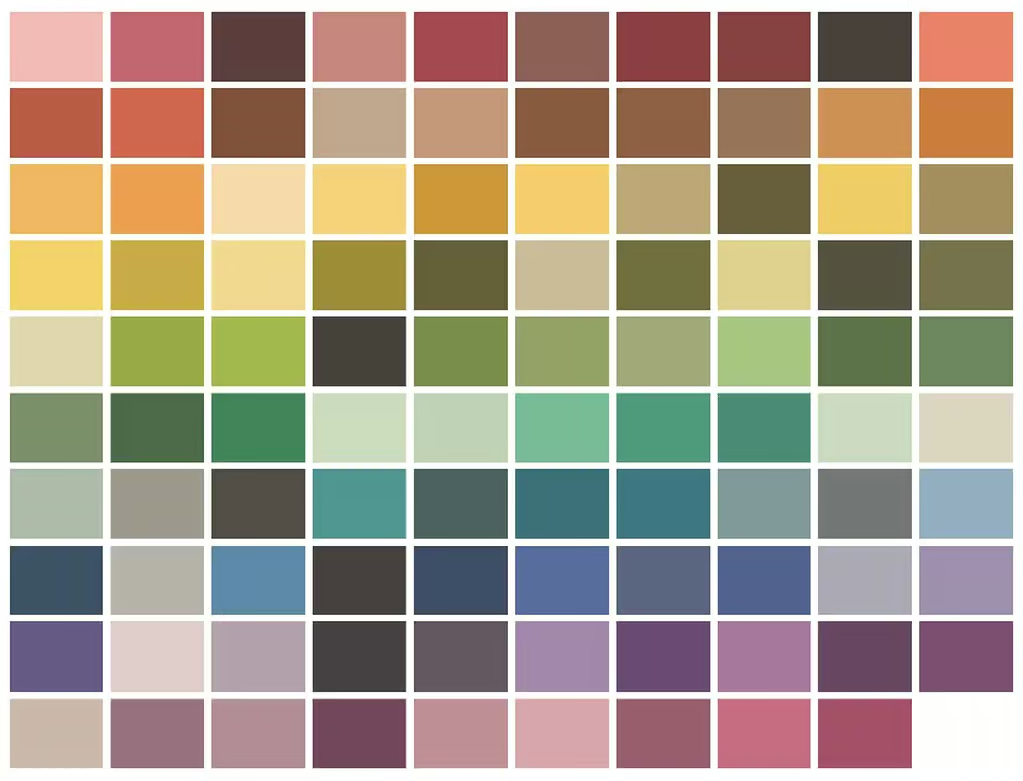
- Rf which is a similar metric to the CRI (Ra) standard that measures color rendering based on comparison to a color palette of 99 colors (CRI only had 9)
- Rg which measures the average gamut shift (hue/saturation) of the source
- A graphical representation of Rg to visually represent which colors are washed out or more vivid due to the light source
For details, you can download the PDF “Evaluating Color Rendition Using IES TM-30-15“.
5. Photometric parameters
Luminous Flux(Flux)
In photometry, luminous flux or luminous power is the measure of the perceived power of light. It differs from radiant flux, the measure of the total power of electromagnetic radiation (including infrared, ultraviolet, and visible light), in that luminous flux is adjusted to reflect the varying sensitivity of the human eye to different wavelengths of light.
The SI unit of luminous flux is the lumen (lm). Until 19 May 2019, one lumen was defined as the luminous flux of light produced by a light source that emits one candela of luminous intensity over a solid angle of one steradian. Since 20 May 2019, the lumen has been defined by fixing the luminous efficacy of monochromatic radiation of frequency 540×1012 Hz (green light with a wavelength of 555 nm) to be 683 lm/W. Thus a 1 lumen source emits 1/683 W or 1.146mW.
In other systems of units, luminous flux may have units of power.
The luminous flux accounts for the sensitivity of the eye by weighting the power at each wavelength with the luminosity function, which represents the eye’s response to different wavelengths. The luminous flux is a weighted sum of the power at all wavelengths in the visible band. Light outside the visible band does not contribute.
Luminous Efficacy(Eff.)
Luminous efficacy is a measure of how well a light source produces visible light. It is the ratio of luminous flux to power, measured in lumens per watt in the International System of Units (SI). Depending on context, the power can be either the radiant flux of the source’s output, or it can be the total power (electric power, chemical energy, or others) consumed by the source.[1][2][3] Which sense of the term is intended must usually be inferred from the context, and is sometimes unclear. The former sense is sometimes called luminous efficacy of radiation,[4] and the latter luminous efficacy of a light source[5] or overall luminous efficacy.[6][7]
Radiant Flux(Fe)
In radiometry, radiant flux or radiant power is the radiant energy emitted, reflected, transmitted, or received per unit time, and spectral flux or spectral power is the radiant flux per unit frequency or wavelength, depending on whether the spectrum is taken as a function of frequency or of wavelength. The SI unit of radiant flux is the watt (W), one joule per second (J/s), while that of spectral flux in frequency is the watt per hertz (W/Hz) and that of spectral flux in wavelength is the watt per metre (W/m)—commonly the watt per nanometre (W/nm).
5. Electrical Parameters
Voltage(V)
Voltage, electric potential difference, electric pressure or electric tension is the difference in electric potential between two points, which (in a static electric field) is defined as the work needed per unit of charge to move a test charge between the two points. In the International System of Units, the derived unit for voltage (potential difference) is named volt. Our LED strip lights are generally 24V or 12V.
Electric Current(I)
An electric current is a stream of charged particles, such as electrons or ions, moving through an electrical conductor or space. It is measured as the net rate of flow of electric charge through a surface or into a control volume. The moving particles are called charge carriers, which may be one of several types of particles, depending on the conductor. In electric circuits the charge carriers are often electrons moving through a wire. In semiconductors they can be electrons or holes. In an electrolyte the charge carriers are ions, while in plasma, an ionized gas, they are ions and electrons.
The SI unit of electric current is the ampere, or amp, which is the flow of electric charge across a surface at the rate of one coulomb per second. The ampere (symbol: A) is an SI base unit. Electric current is measured using a device called an ammeter.
Power Consumption(P)
In electrical engineering, power consumption refers to the electrical energy per unit time, supplied to operate something, such as a home appliance. Power consumption is usually measured in units of watts (W) or kilowatts (kW).
Power consumption is equal to voltage multiplied by current.
Power Factor(PF)
In electrical engineering, the power factor of an AC power system is defined as the ratio of the real power absorbed by the load to the apparent power flowing in the circuit, and is a dimensionless number in the closed interval of −1 to 1. A power factor magnitude of less than one indicates the voltage and current are not in phase, reducing the average product of the two. Real power is the instantaneous product of voltage and current and represents the capacity of the electricity for performing work. Apparent power is the product of RMS current and voltage. Due to energy stored in the load and returned to the source, or due to a non-linear load that distorts the wave shape of the current drawn from the source, the apparent power may be greater than the real power. A negative power factor occurs when the device (which is normally the load) generates power, which then flows back towards the source.
In an electric power system, a load with a low power factor draws more current than a load with a high power factor for the same amount of useful power transferred. The higher currents increase the energy lost in the distribution system and require larger wires and other equipment. Because of the costs of larger equipment and wasted energy, electrical utilities will usually charge a higher cost to industrial or commercial customers where there is a low power factor.
But in the integrating sphere test report, since our led strip is a DC12V or DC24V led strip, the PF is always 1.
LEVEL
The parameter LEVEL is always OUT. So we ignore it.
WHITE
WHITE means which Color Tolerance standard we selected.
6. Instrument Status
Integral T means integration time.
Ip refers to the photoelectric saturation; it is related to the length of the integration time selected during the test, and the selection (automatic integration time) IP should be greater than 30%, which is an ideal state. If the integration time is selected to be 100 seconds, the IP will be less than 30%, the test time will be fast, and other optoelectronic parameters will not be affected.
Footer has additional information such as Model Name, Number, Tester, Test Date, Temperature, Humidity, Manufacturer, and Remarks.
After reading this article, I believe that you can easily read all the parameters of the integrating sphere test report. If you have any questions, please leave comments or send messages through the form on the website. Thank you.
Conclusion
Understanding how to read an Integrating Sphere Test Report is critical for anyone involved in lighting. By focusing on key parameters like luminous flux, color rendering index, and color temperature, one can make informed decisions about which light source to use. The report can also help identify any potential issues with the light source, allowing for better and more efficient lighting solutions.
LEDYi manufactures high-quality LED strips and LED neon flex. All of our products go through high-tech laboratories to ensure the utmost quality. Besides, we offer customizable options on our LED strips and neon flex. So, for premium LED strip and LED neon flex, contact LEDYi ASAP!